Tilapia farm management software: what to track
What tilapia farm management software should track: stocking, splits, feed by weight band, grading, survival, and a harvest record buyers accept.
5 min read
Tilapia has a reputation as the forgiving fish, and the reputation is roughly deserved. The species tolerates water that would kill trout and crowding that would stress shrimp. The margin is another matter. Feed runs past half the cost of a cycle, buyers pay by size class, and the difference between a profitable pond and a losing one is usually decided in records nobody kept.
That is why the useful question when evaluating tilapia farm management software is not which product has the most features. It is whether the software models the handful of things a tilapia operation does every week. A general fish farm platform that handles them well beats a tilapia-branded product that does not.
The record has to follow cohorts, not ponds
A tilapia farm rarely runs one batch at a time. Fingerlings arrive in staggered cohorts so harvests can be staggered too, and at any moment the farm holds several generations at different sizes. A record built around ponds alone cannot answer the questions that matter: where cohort three went after nursery, what it has eaten since, and how its growth compares to the cohort before it.
The model that works separates the population from the unit that holds it. The cohort is a batch with its origin and history; the pond or tank is a placement it occupies for a period. Production tracking built on that separation survives transfers and splits, which is exactly where pond-keyed records fall apart.
Grading is routine, so reconciliation must be too
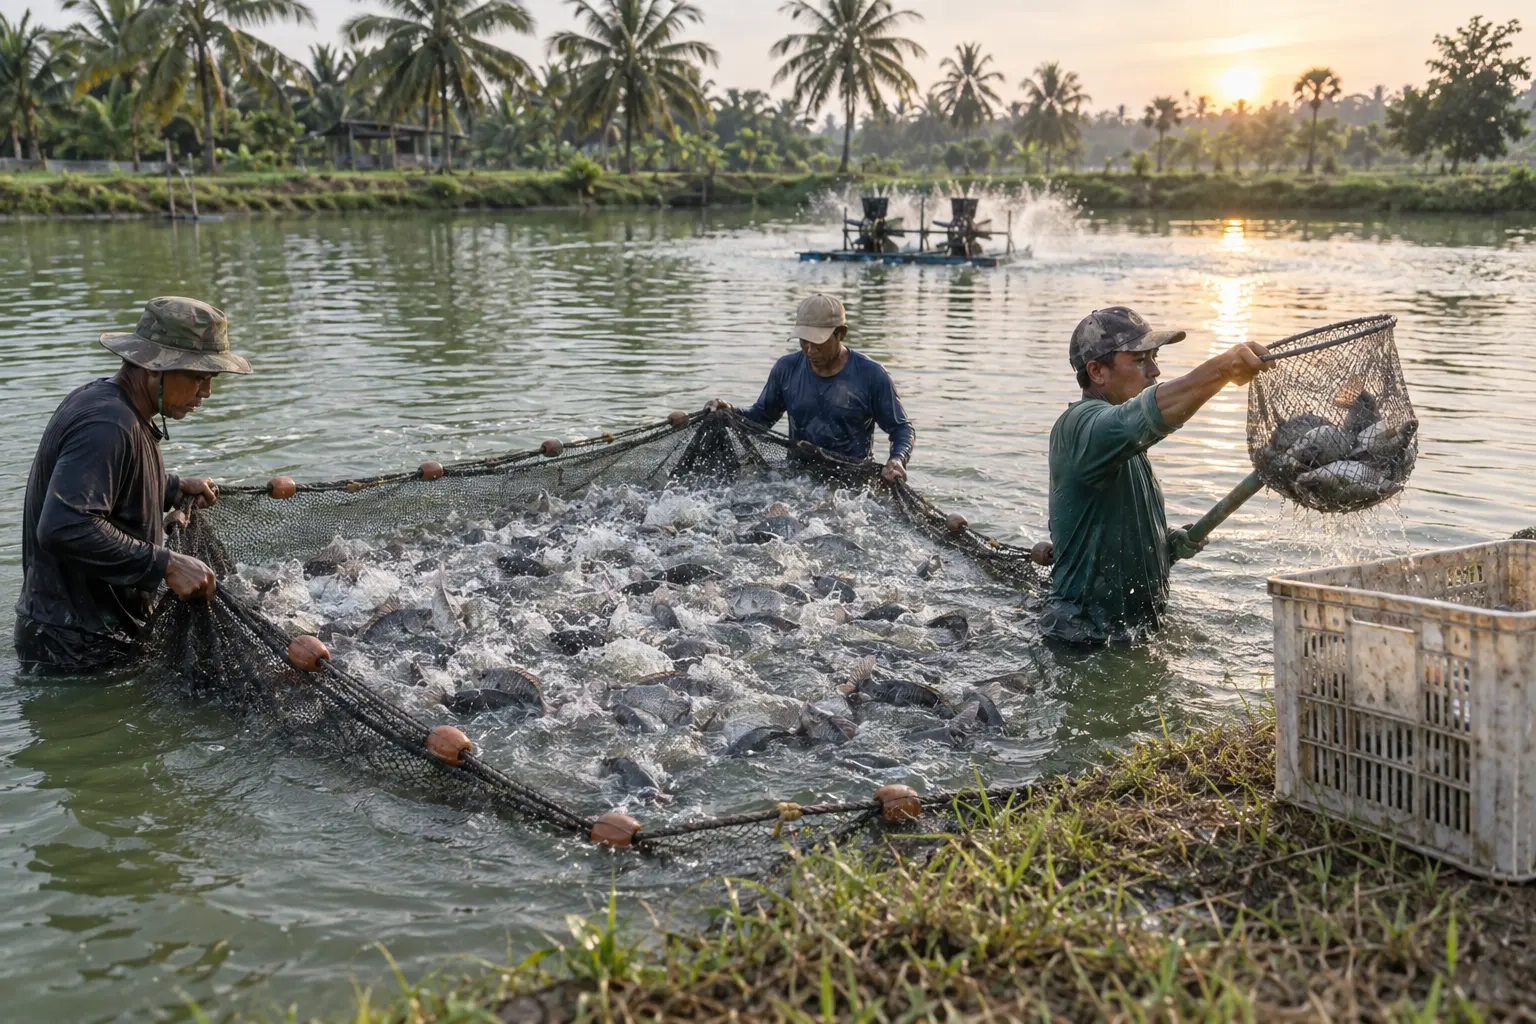
Tilapia grow apart. Left alone, a cohort spreads into a size range wide enough that the largest fish suppress the smallest, so farms grade repeatedly: empty units, distribute size classes across several more, restock. Thousands of fish move in a day.
Software that treats grading as an afterthought produces the familiar result, counts that no longer add up to anything. What to look for is grading run as a session that reconciles: fish out, size classes in, and a check that the totals close. If the demo cannot show a grading day ending with every destination unit carrying a correct count and average weight, the rest of the feature list does not matter.
Feed follows weight bands, or the cost figure is fiction
Tilapia feeding runs off a table: rate against weight band and phase, adjusted as the fish grow. The table itself belongs to the farm. Rates differ by strain, climate, water temperature, and feed brand, so be suspicious of software that ships a fixed tilapia curve and proud of software that holds your own.
For reference rates by weight band, the free tilapia feeding chart and calculator turns a count and an average weight into a daily feed range. From that table, the platform should produce a daily ration per unit from current biomass, and then record what actually happened: the feeding confirmed, the quantity changed on the ground, or the pond skipped. Not-fed days matter as much as fed ones. A feed conversion ratio computed over unconfirmed plans is not a cost figure, it is a hope.
Survival is maintained daily, not discovered at harvest
The gap between fingerlings stocked and fish harvested is where a tilapia budget quietly dies. Daily mortality entries per unit keep the live count honest, which keeps the biomass honest, which keeps every ration calculated from it honest. An operation that only learns its survival rate at harvest has been feeding a wrong number for months.
Water quality belongs in the same record, not a second one
Tilapia’s tolerance is exactly why its water data gets neglected: the fish survive what other species would not, so the log slips. The cost shows up as growth, not as a fish kill. Dawn oxygen sag in a heavily fed pond, ammonia climbing through an intensive cycle, temperature swings that move feeding rates. Each of these depresses growth for weeks before it kills anything.
The software question is where those readings live. Water quality bound to the growing unit sits next to the batch that was in it, so a slow month on the growth curve can be read against the water it happened in. Threshold alarms cover the nights, whether readings come from probes or a technician with a meter. A parameter log in a separate file explains nothing, because it cannot be laid over the feeding and mortality it caused.
The harvest record has an outside reader
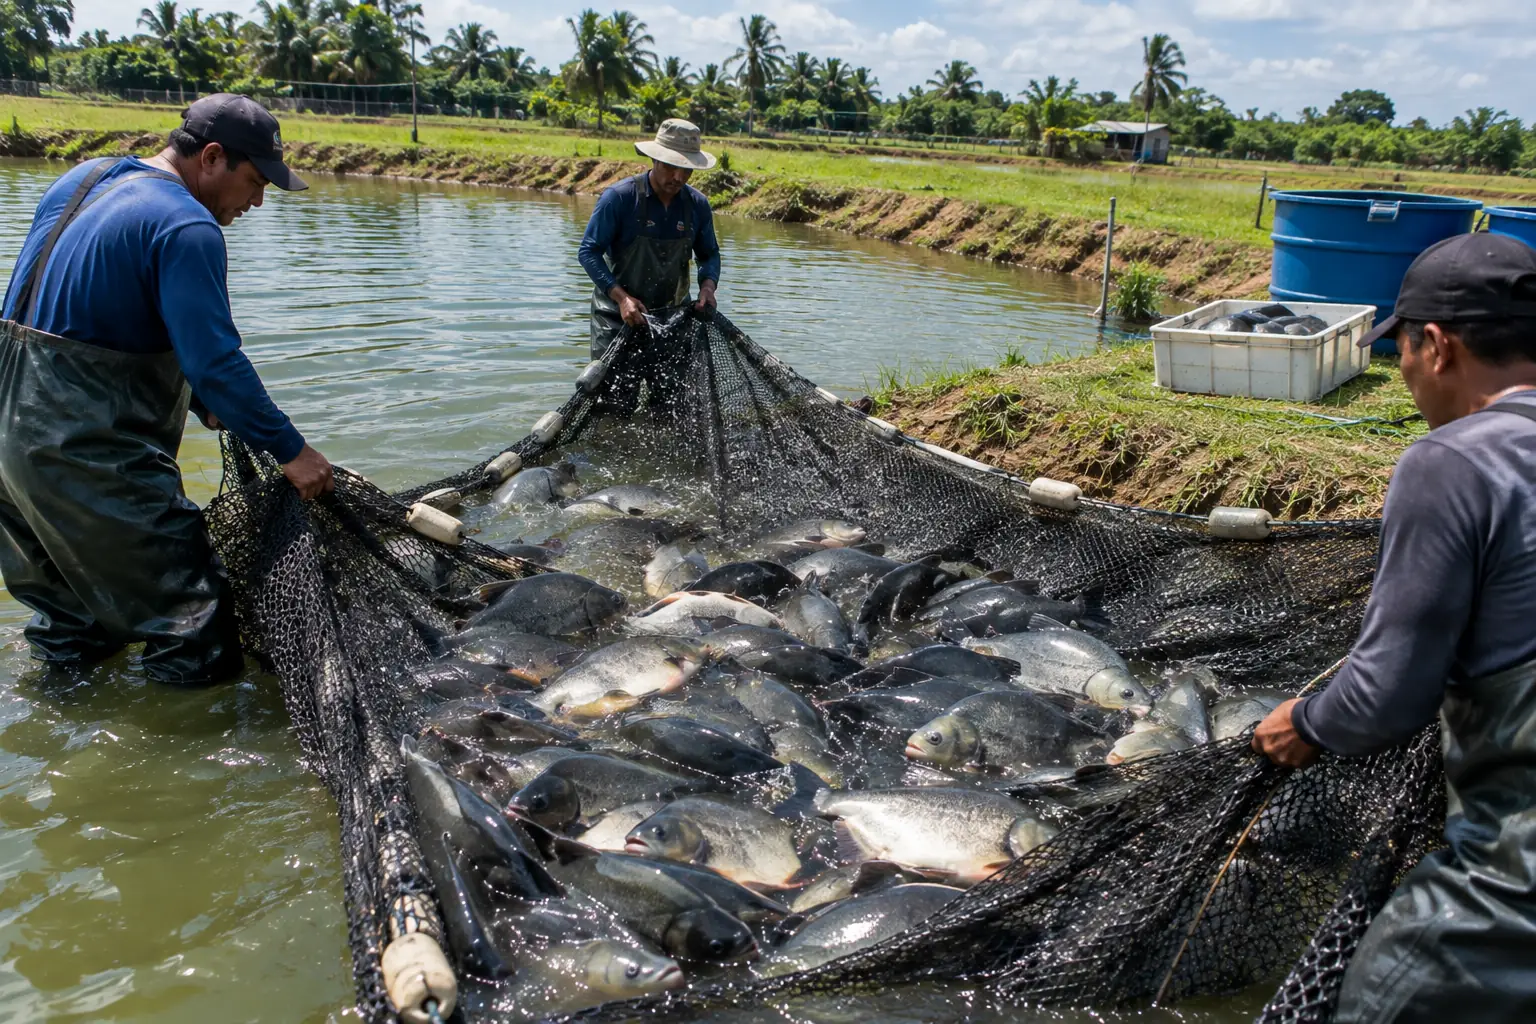
Tilapia is sold to processors, live markets, and increasingly to buyers who ask where the fish came from and what went into it. The production record is no longer internal paperwork. Per-pond reports covering stocking, feed, mortality, and growth over the cycle, exportable to Excel or printed as PDF, are what turns that request from a week of reconstruction into a print job.
How to test tilapia software in a demo
Skip the slide deck and run the farm’s own week. Have the vendor stock a staggered cohort, split it after nursery, run a grading day that reconciles, and then show feed conversion for one pond over the cycle. Those four operations expose more than any feature matrix, and the buyer guide covers the structural differences behind them. A demo worked on your own ponds and your own feed table tells you the rest.
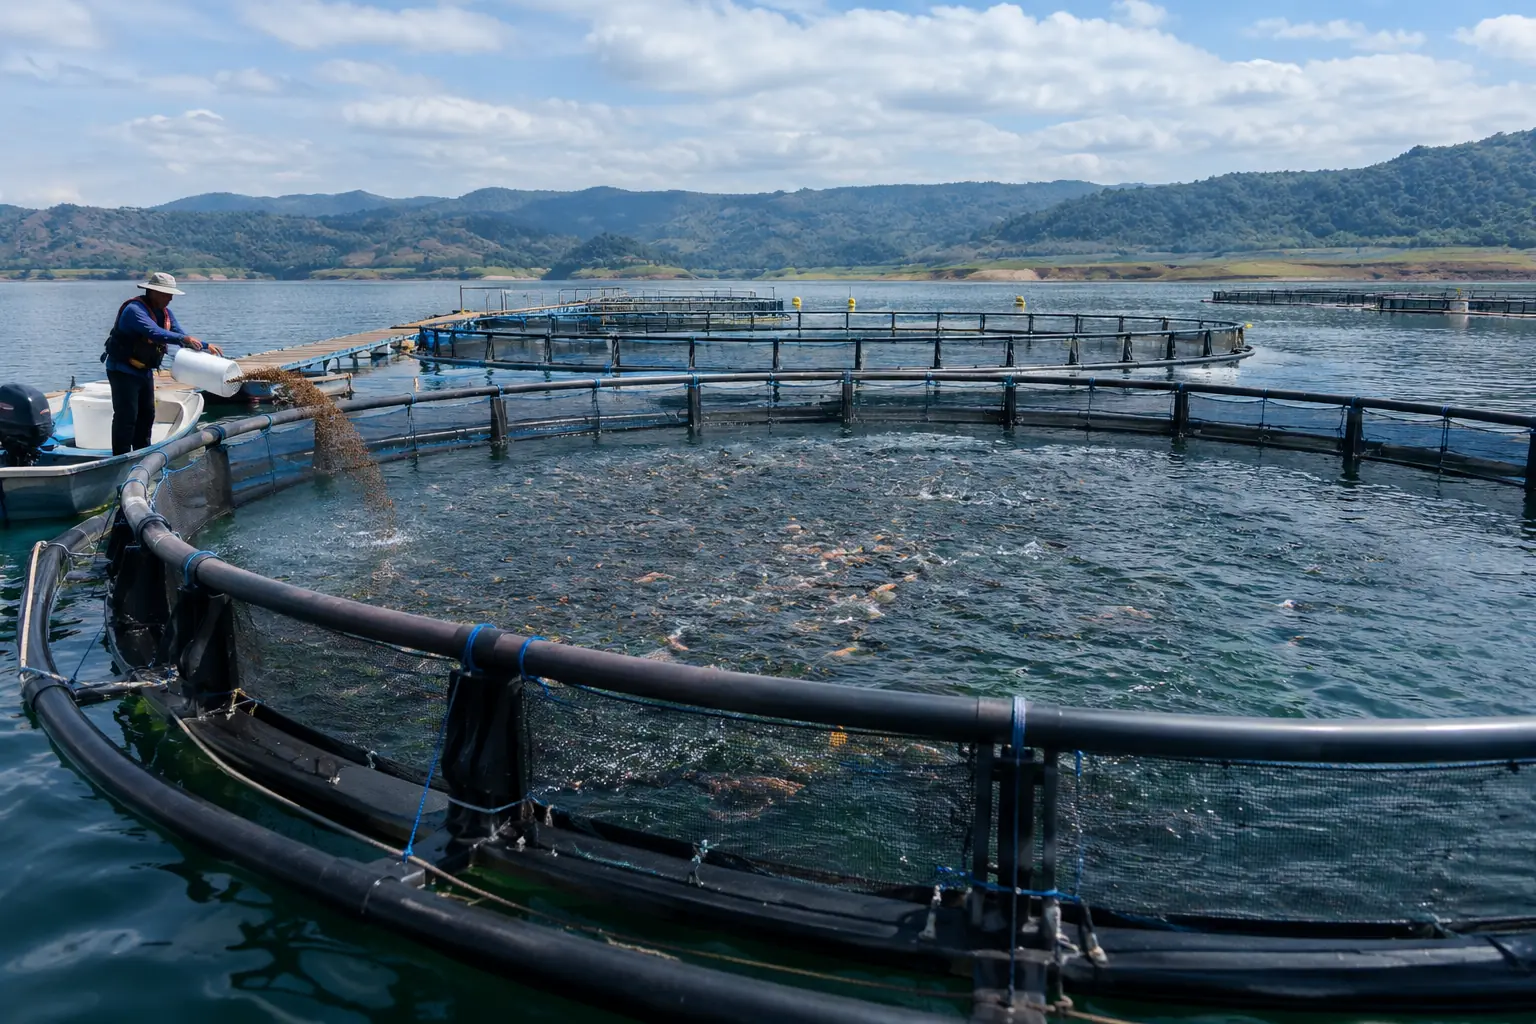
Two setups get their own guides: tilapia in floating cages, where each cage is its own unit on shared water, and tambaqui and cachama, which often share a farm, and sometimes a pond, with tilapia.