Aquaculture feed management software
Feed management software generates the daily ration for every growing unit and records what was actually delivered, including the days nothing was fed. Feed is the largest recurring cost on most operations and the one most often recorded from memory. AquaOS generates the daily ration for every unit from a feed matrix, then records what the crew confirmed, including the days nothing was fed.
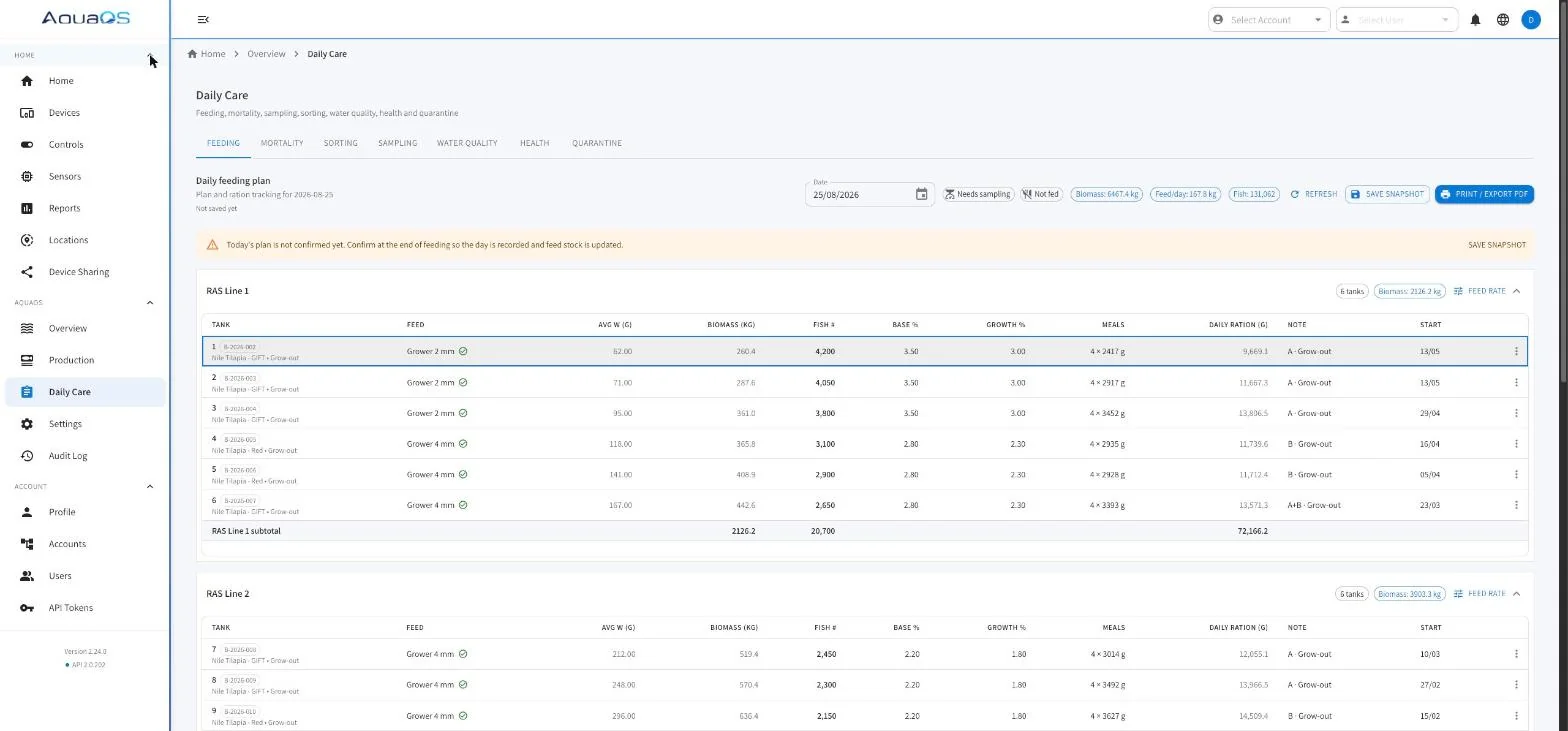
- Ration per unit, generated daily
- Feed matrix by species and weight band
- Confirmed feedings and skipped days
- Feed runway against stock on hand
How feeding works in AquaOS
The feed matrix
A table mapping species, weight band, and cultivation phase to a feeding rate and a feed item.
It encodes what the farm already knows, so the platform calculates rations the same way the experienced operator would. The matrix is edited in the platform and applies from the next daily plan.
The daily plan
Every morning the platform produces a ration per stocked unit, derived from current biomass, the matrix rate, and the number of feedings the cultivation phase calls for.
The plan lists the feed item, the quantity, and the units to visit.
Confirmation, including the negative
The crew confirms each unit as fed, or marks it not fed with a reason.
A day with no confirmation is visibly missing rather than silently assumed. This is the difference between a feed record and a feed plan, and it is what makes any later feed conversion figure defensible.
Feed items and stock
Feed items are held with current stock and a reorder threshold.
Confirmed feedings draw down stock, and low-stock items surface before the bin is empty rather than the morning it runs out.
Feed runway and forecast
Projected demand is calculated forward from current biomass, the growth model, and the matrix, then compared against stock on hand.
The result is a number of days, per feed item, before the next delivery has to arrive.
Per-unit overrides
A unit can carry a manual ration override when the situation calls for it, for example during a treatment or a transition.
Overrides are explicit and visible on the plan, so an override left in place does not quietly suppress feeding for weeks.
The feeding loop
-
Plan generated
Current biomass per unit meets the feed matrix. Each stocked unit gets a ration, a feed item, and a number of feedings for the day.
-
Crew feeds
The plan is worked from a phone at the tank side. Each unit is confirmed as fed or marked not fed with a reason.
-
Record closes
Confirmed quantities become the feed record for the day and draw down feed stock. The day is saved and can be reviewed later.
-
Runway updates
Remaining stock is compared against projected demand. Items approaching their reorder threshold are flagged for the next order.
What a real feed record changes
Feed conversion you can defend
FCR calculated from confirmed feedings and measured growth is a number worth acting on. FCR calculated from a plan nobody verified is a number that flatters whoever wrote the plan.
Nothing goes unfed unnoticed
Skipped days are recorded, not inferred. A unit that quietly missed a week of feeding shows up on the record instead of in the growth curve two months later.
Orders sized to demand
Runway based on projected biomass tells you when to order and roughly how much, instead of ordering on habit and discovering the gap at the worst moment.
Related capabilities
Production tracking
Biomass has to be right before the ration can be. How splits and sampling keep it right.
Reporting and traceability
Feed given, growth, and mortality on one per-pond report over any period.
Shrimp farming
Feed tables by weight band across a pond cluster, and what changes at scale.
Feed runway calculator
Days of feed left, the run-out date and the date to order by.
Feed conversion ratio (FCR) calculator
Feed conversion ratio from feed given and biomass gained.
Tilapia feeding chart and calculator
Reference feeding rates by weight band and a daily feed range for a pond or tank.
Frequently asked questions
Can we keep using our own feeding table?
Yes. The feed matrix is defined per operation. Species, weight bands, phases, rates, and feed items are all entered by the farm, so the platform calculates rations the way the operation already does rather than imposing a generic table.
What happens on a day when a pond is not fed?
It is marked not fed with a reason, and that is recorded as an explicit event. Reports show not-fed days separately from fed days, so a feed conversion figure over a period reflects the days feeding actually happened.
How is feed stock tracked?
Feed items carry current stock and a reorder threshold. Confirmed feedings draw down stock, and projected demand from the growth model is compared against what remains to give a runway in days per item.
See AquaOS on your operation
Bring a real production scenario. AquaOS is walked through on your operation, not a canned dataset.