Aquaculture reporting and traceability software
AquaOS is aquaculture reporting and traceability software. Reports are generated from the live production record rather than assembled from files. Pond status, per-pond production over any period, forward projections, and a complete audit trail of every change, all exportable to Excel and print-ready PDF.
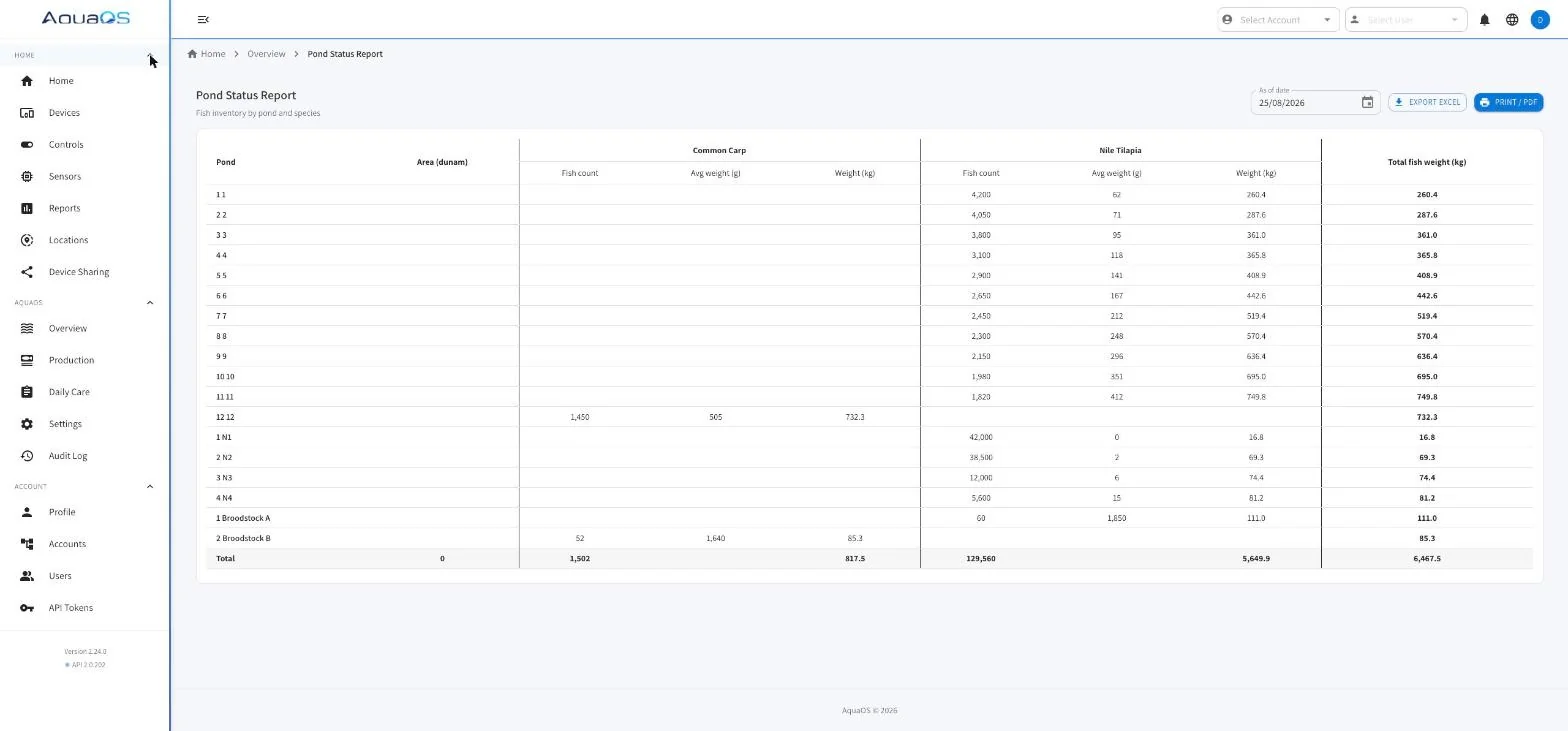
- Pond status by species and unit
- Per-pond report over any period
- Growth and feed projection
- Excel and PDF on every report
What reports does AquaOS produce?
Six outputs, all generated from the live production record: pond status by species and unit as of any date, a per-pond production report over any period, growth and feed projection, an event timeline, an audit log, and XLSX or PDF export of each.
Pond status report
Fish inventory by pond and species as of any date: count, average weight, area, and total biomass, with a grand total.
Current status comes from live data; past dates are reconstructed from the saved daily plans, and the report states which it is showing.
Per-pond production report
One unit over one period, with biomass at start and end, adjusted growth accounting for stock moved in and out, feed given, not-fed days, mortality, estimated feed conversion, water quality, and a timeline of every event.
This is the document an owner review, a bank, or an insurer asks for.
Growth and feed projection
Forward projection of biomass and average weight from the growth model, and the feed demand that follows from it.
Used for planning harvest windows and sizing the next feed order.
Event timeline
Every stocking, split, transfer, sort, sampling, mortality event, and closure for a unit in date order, with counts and weights.
It reads as the narrative of what happened in that pond.
Audit log
Who changed what, when, and what the value was before.
Corrections that propagate backward through the record, for example a re-sampling that revises earlier weights, are surfaced with a warning rather than applied silently.
Exports
Reports export to XLSX and to print-ready PDF.
Excel rather than CSV is deliberate: spreadsheet software re-encodes CSV on save, which corrupts non-Latin text. XLSX survives any save and reopen cycle.
What changes when reports come off the live record?
Reports get produced because they cost a page load, the figures reconcile because they come from one record, and model-derived estimates are labelled as estimates.
Reports get produced
A report that costs a day gets produced once a quarter under duress. A report that costs a page load gets produced weekly and actually informs a decision.
The numbers reconcile by construction
Everything is drawn from one record, so the biomass on the pond status report and the biomass behind the feed plan cannot disagree. They are the same figure.
Estimates are labelled as estimates
Feed conversion between samplings is model-derived and the report says so. A platform that presents a modelled figure with the same confidence as a measured one is training its users to distrust both.
Related capabilities
Frequently asked questions
Can a report be produced for a past date?
Yes. Pond status supports an as-of date, and the per-pond report runs over any period. Past dates are built from the saved daily plans for those days, so a date with no saved plan is reported as such rather than silently interpolated.
Why XLSX rather than CSV?
Because CSV and non-Latin text do not survive Excel. Excel re-encodes CSV on save and drops the encoding marker, so a file that opened correctly becomes unreadable after the user closes it with save. XLSX has no encoding ambiguity, so every export in the platform is XLSX.
Is feed conversion ratio calculated per pond?
Yes, as an estimate on the per-pond report. It is feed given divided by biomass gain, adjusted for stock moved in and out and for mortality. Between samplings the biomass is model-derived, so the figure is labelled as an estimate and the report says what it is based on.
Can reports be printed for an insurer or a bank?
Yes. The per-pond report has a print layout that produces a clean PDF with the period, the unit, the KPIs, the charts, and the event tables. It is designed to be handed to someone outside the operation.
Is there a record of changes to the data?
Yes. The audit log records who changed what and when, with the previous value. Changes that would revise earlier figures are flagged with a warning describing the effect before they are applied.
See AquaOS on your operation
Bring a real production scenario. AquaOS is walked through on your operation, not a canned dataset.