Trout farm management software: what to record
What trout farm management software has to record: a feed table the farm owns, raceways in series, grading most weeks, and where the eggs came from.
6 min read
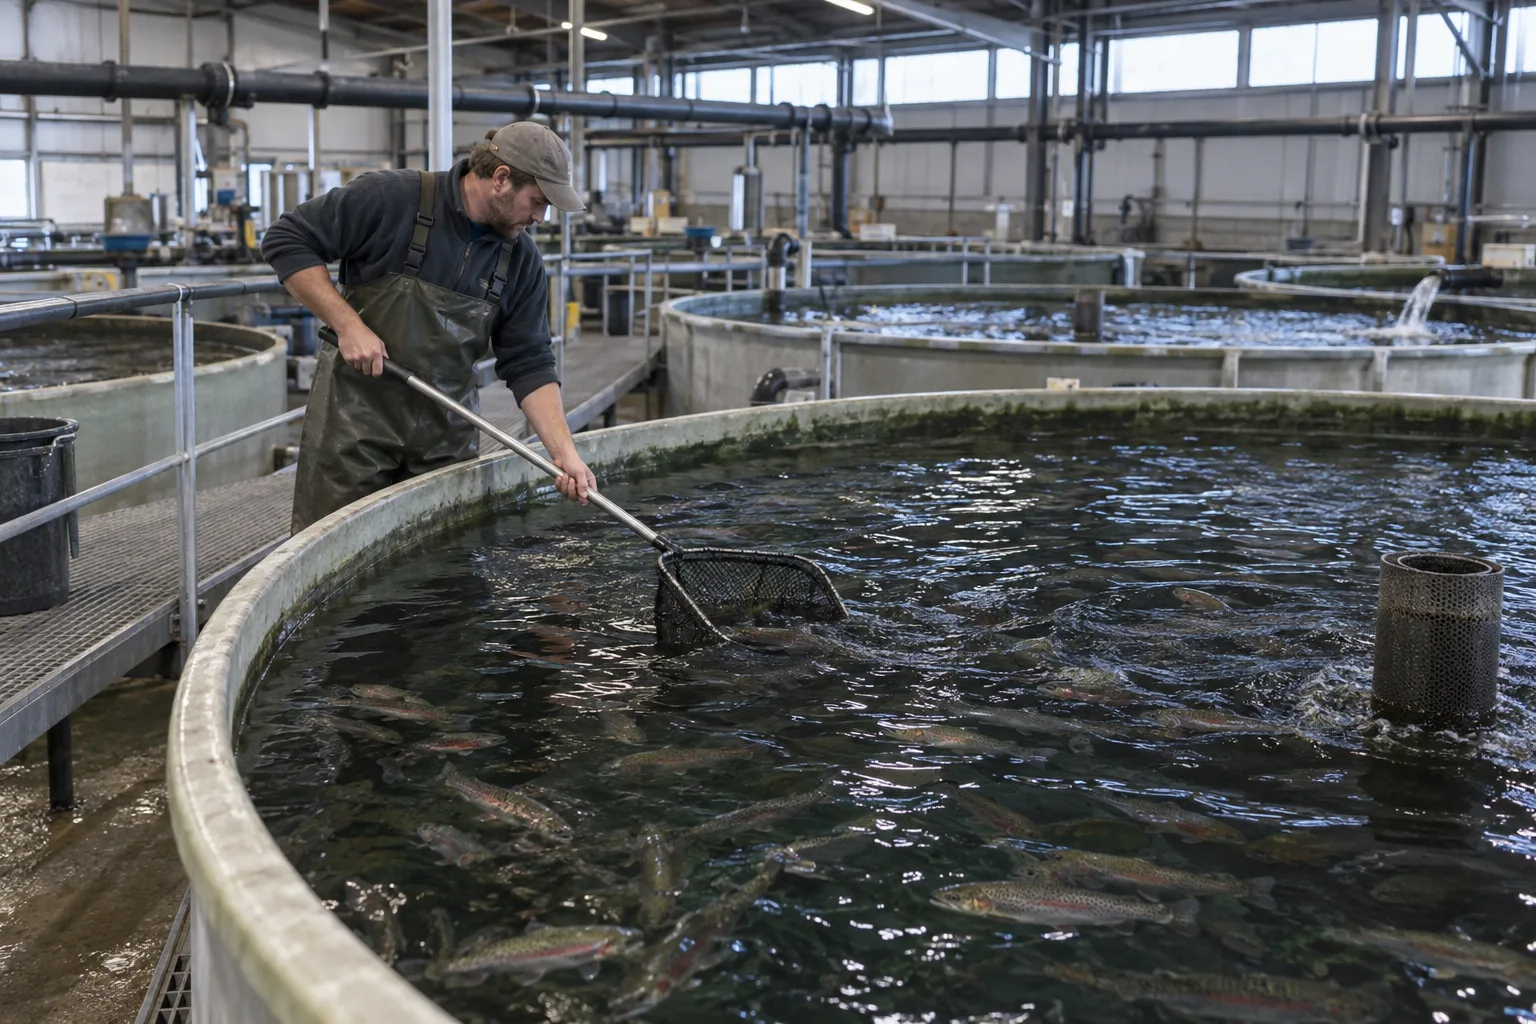
Trout are farmed in cold water that moves. A pond is a container the farm fills and controls. A raceway is a length of borrowed river: the water arrives at whatever temperature the season decided, passes through the fish, and leaves carrying what they produced. Stocking density, growth rate and how often a crew has to grade all follow from that, and so does the shape of the record.
So the useful question when evaluating trout farm management software is not whether trout appears on a species list. It is whether the record can hold a feeding table the farm wrote, units that are hydraulically connected rather than independent, and a grading day that comes round most weeks. A general fish farming platform that models those well is worth more than a trout label on a feature matrix.
The feeding table has to belong to the farm
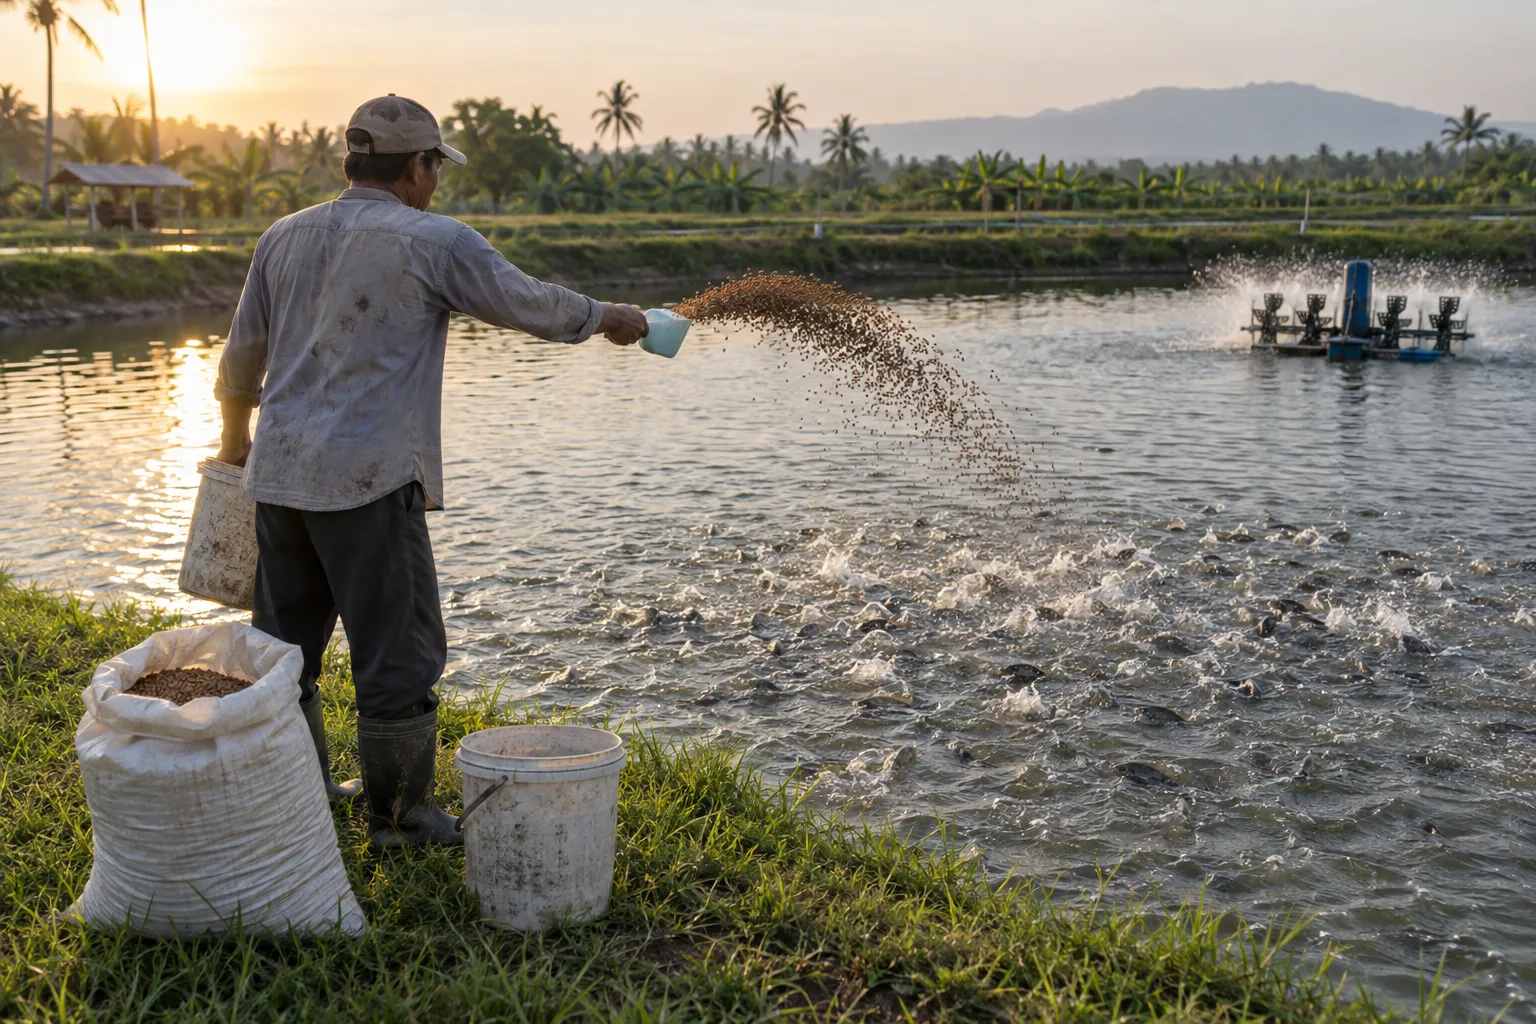
No two trout farms feed the same way. Rates move with strain, water source, season, feed brand and the size the market wants, so a platform that ships a fixed trout curve is asking the operation to adopt someone else’s husbandry.
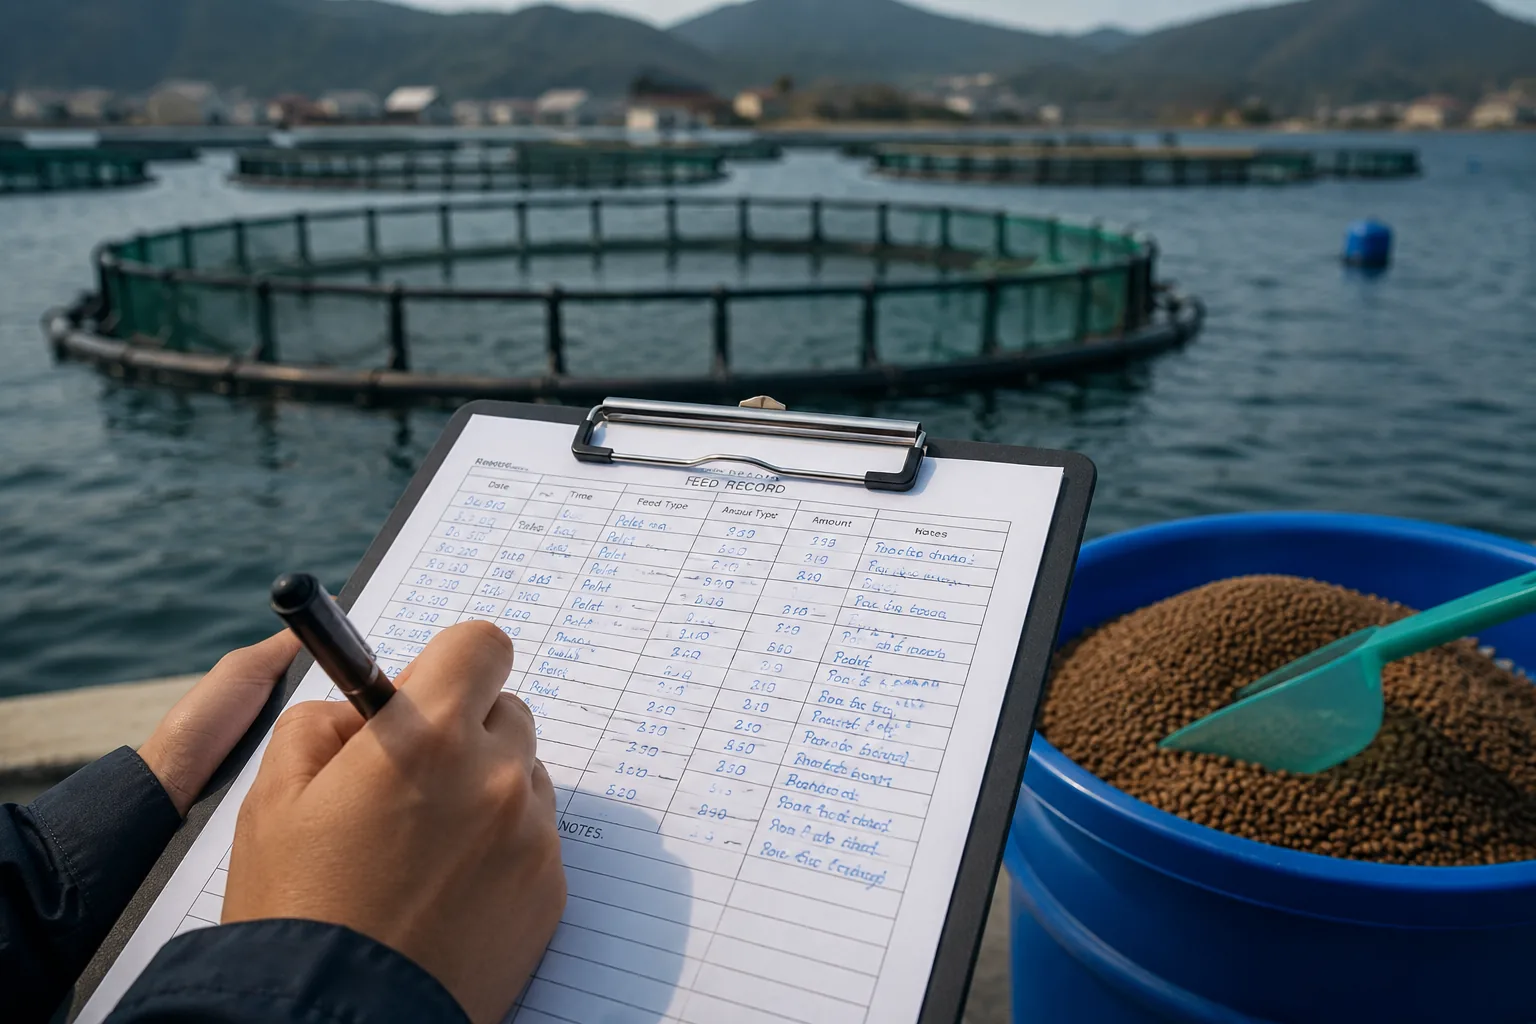
What works is a table the farm writes and edits itself. The feed matrix maps species, weight band and cultivation phase to a rate and a feed item, and both the species and the phases are defined per farm rather than picked from a closed list. From that table the platform produces a daily ration for every stocked unit out of current biomass, and the crew confirms what was actually delivered, including the days a unit was not fed at all. Those days are the difference between a feed conversion figure and a guess. A trout cycle is long enough that an unconfirmed plan can run for a month before anyone notices the fish are behind it.
Raceways run in series, so a reading belongs to a unit and not to the farm
In a flow-through system the water leaving one raceway is the water entering the next. Oxygen falls along the row and metabolites accumulate, so the unit at the tail is a different environment from the one at the head, on the same day, in the same weather.
A record that stores water quality against the site, or against the device that took the reading, flattens that difference and loses the thing it was measuring. Readings bound to the growing unit sit beside the batch that was in it, at the density it was held at, on the feed it was getting. That is what turns a slow month on the growth curve into an explanation instead of a mystery. It also settles where a probe goes: instrumenting the head and the tail of a series answers a question that one sensor in the middle cannot.
Trout spread fast, so grading is routine and reconciliation is not optional
Trout grade out. A cohort left alone widens into a size range where the largest fish suppress and eventually eat the smallest, so farms grade often, and a grading day moves thousands of fish between units in a few hours.
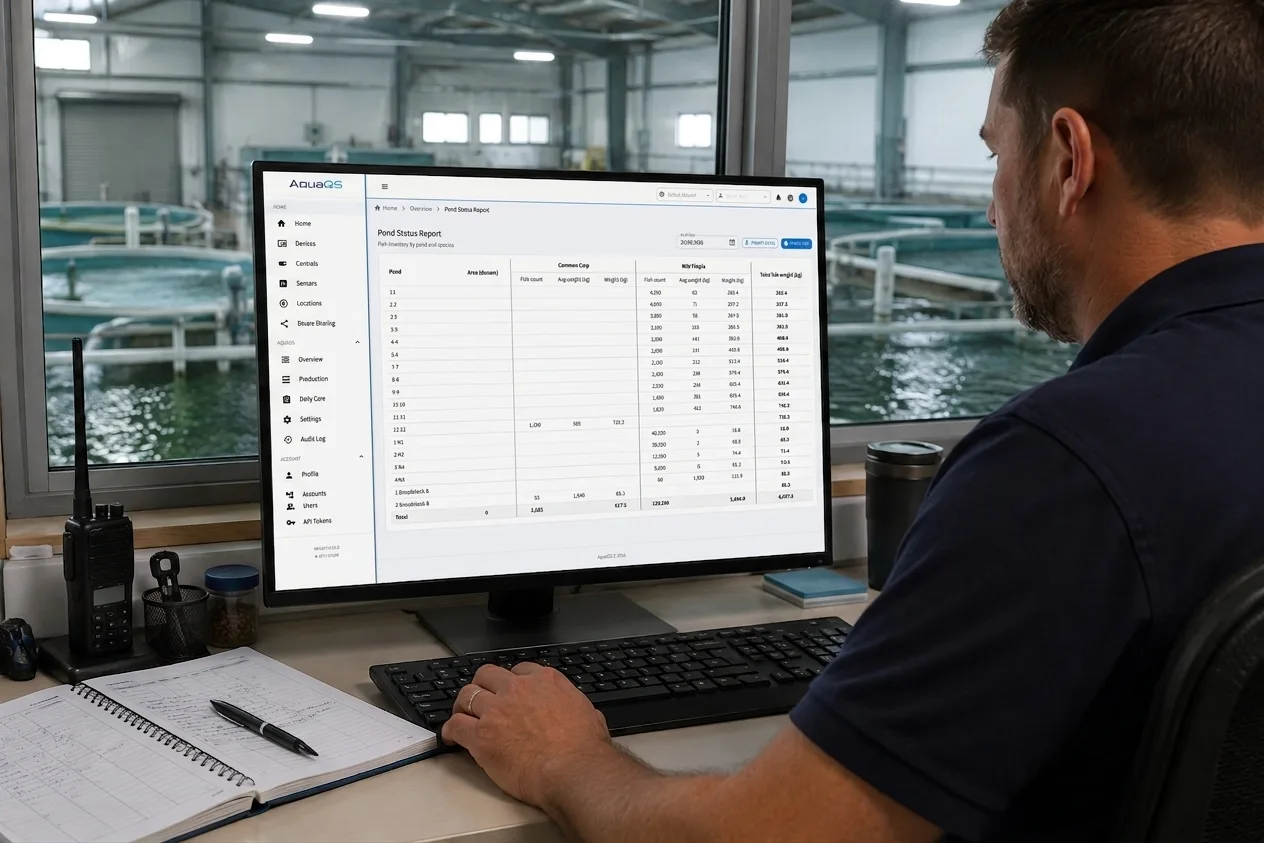
Software that treats grading as a form filled in afterwards produces the familiar result, counts that stop adding up to anything. What to look for is grading run as a session that reconciles: fish out of the source unit, size classes into the destinations, and a check that the totals close before the session can be closed. A grading day that ends with every destination carrying a correct count and average weight is the single most informative thing a trout demo can show, because it exercises the data model rather than the interface.
Bought eggs and on-farm eggs are two different lineage problems
Most trout farms buy in eyed eggs or fingerlings. Some hold their own broodstock. The record has to survive both, because the question at the other end of the cycle is the same: where did this fish come from, and what happened to it since.
For bought stock the answer starts at a delivery, with a batch carrying an origin and a date, then a history of every split, transfer and merge it went through. For a farm producing its own it starts earlier, at a broodstock group and a spawning event with its hatch result recorded, including the spawns that failed. Either way the population and the unit holding it have to be separate things in the model. Batches and placements that keep them separate survive a split down the row; a record keyed on the raceway does not.
Oxygen is the constraint, and an alarm is only useful if it names the unit
Trout have a narrow tolerance and a flow-through farm has no buffer. A pump failure, a screen blocked with leaves, or a warm still night can end a cycle in an afternoon, and the difference between a scare and a loss is usually how fast somebody was told.
Threshold alarms on unit-bound readings are the mechanism, and two details decide whether they work at 03:00. The alarm has to name the growing unit rather than the device, so the person walking out with a torch knows which raceway to check. And readings taken while the connection was down have to arrive when it returns rather than vanish, because the gap in the record is otherwise exactly where the incident was. A history with a hole in it at the interesting moment is not a history.
A cold-water cycle is long enough that projection earns its place
Trout take months to reach portion size and longer for the larger grades. Across that span a farm commits to feed orders and harvest windows well before it can see whether the fish will arrive.
Forward projection of biomass and average weight from the growth model, with the feed demand that follows from it, is what makes those commitments something other than habit. The limit is worth understanding before a demo: a projection of this kind models the cohorts that exist now and holds the count constant, so it answers what happens if nothing changes rather than forecasting splits and sales nobody has entered. Read against real weighings it is still the earliest warning available that a cohort is falling behind.
How to test trout software in a demo
Run your own farm rather than the vendor’s. Ask them to set up your species and your own cultivation phases, load a few rows of your feed table, stock a raceway, split it down the row, then run a grading day that reconciles. Finish by asking for a report on one unit over the cycle, with feed given, not-fed days, mortality and growth, exported to Excel. Those operations expose more than any feature matrix. The buyer guide covers the structural differences behind them, and a demo worked on your own water tells you the rest.