FCR tracking software: measured vs estimated FCR
FCR tracking software for aquaculture: why a cycle FCR drifts from what the fish did, and how measured conversion between two weighings fixes it.
6 min read

Feed conversion ratio is the simplest number in aquaculture to write down and one of the hardest to trust. The formula is feed given divided by biomass gained over the same period. Both halves of that fraction are easy to get wrong, and a cycle FCR usually ends up describing the record rather than the fish.
This guide covers where the drift comes from, what separates a measured conversion from an estimated one, and what to test when you evaluate FCR tracking software. For a quick figure on a single pond, the FCR calculator does the arithmetic. The rest of this page is about getting inputs into it that deserve the answer.
Why a cycle FCR drifts away from the fish
The ratio has a numerator and a denominator, and each one has its own ways of going wrong.
Feed: the plan is not what was fed
Most feed records start as a plan: a ration per pond from a feeding table, printed or sent in the morning. If the record assumes the plan was carried out, every pond skipped because of low oxygen, every half ration because the bag ran out and every day the crew never reached the far ponds disappears into the numerator. The feed figure is then larger than what the fish received, and the FCR looks worse than it was.
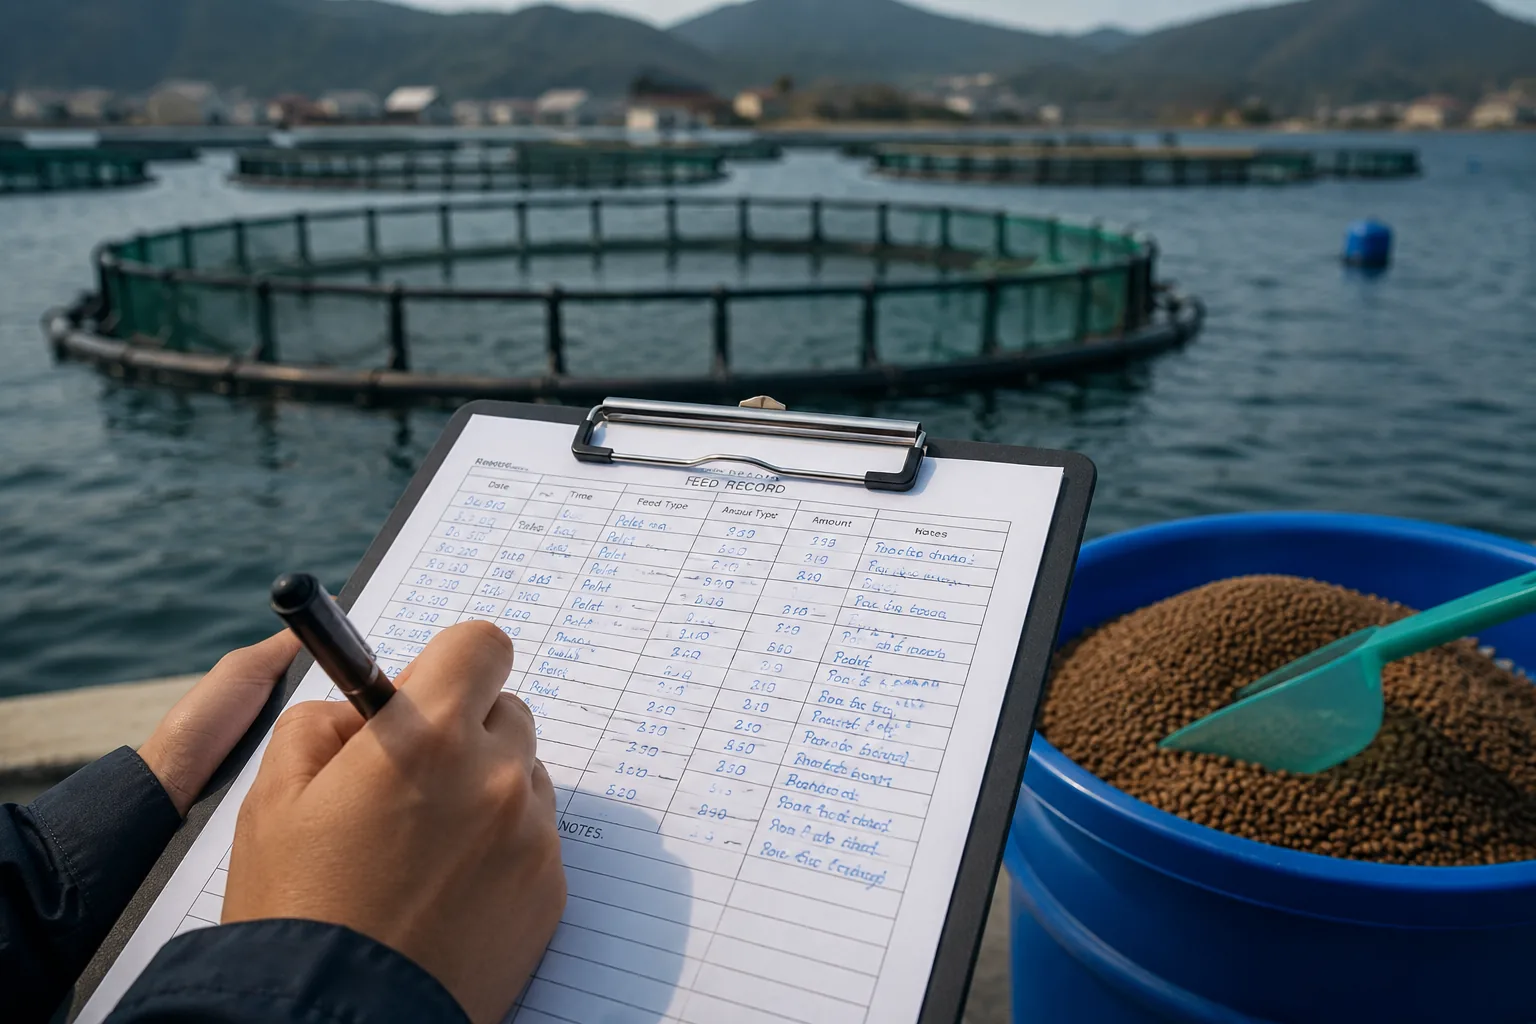
The fix is a feed record built from confirmation, not intention. A daily plan per unit that the crew confirms as fed, or marks not fed with a reason, turns the plan into an account of what happened. Our guide to feed records that hold up covers that in detail.
Not-fed days that were never written down
A skipped day is data. A pond not fed for three days during a treatment or a weather event should show three explicit not-fed days, not three days of nothing that a spreadsheet later fills with the planned ration. In AquaOS feeding, a not-fed day is recorded as such and gates the growth the platform attributes to that period, so the biomass does not keep climbing on paper while the fish were not eating.
Mortality counted late or in bulk
Mortality belongs in the denominator. Fish that ate for weeks and then died took feed and left no gain. If the dead are removed daily but recorded weekly, or estimated at harvest, the biomass carried in the record is too high for most of the cycle, the gain looks larger than it was, and the FCR looks better than it was. The two errors, overstated feed and understated mortality, can partly cancel, which is how a wrong FCR ends up looking plausible.
Fish moved in and out
Grading and transfers move biomass between units. A pond that received a graded class on day 40 gained biomass it never grew; the pond that gave the fish lost biomass it did grow. If the moves are not recorded with their counts and weights, one pond’s FCR looks excellent and the other’s looks terrible, and neither describes the fish. A grading session that reconciles against its source before it closes is what keeps the biomass of each unit honest through the move.
Biomass estimated instead of weighed
Between samplings, biomass is a calculation: count times an average weight, projected forward from a growth model. That estimate is useful for daily rations, but it is not a measurement. A cycle FCR computed against a modelled biomass tells you how well the model was tuned as much as how well the fish converted.
Measured FCR: between two weighings
A measured conversion is bounded by two real weighings. Take the biomass at the first sampling and at the second, adjust the gain for fish moved in and out of the unit and for mortality in between, and divide the confirmed feed given over the same days by that gain.
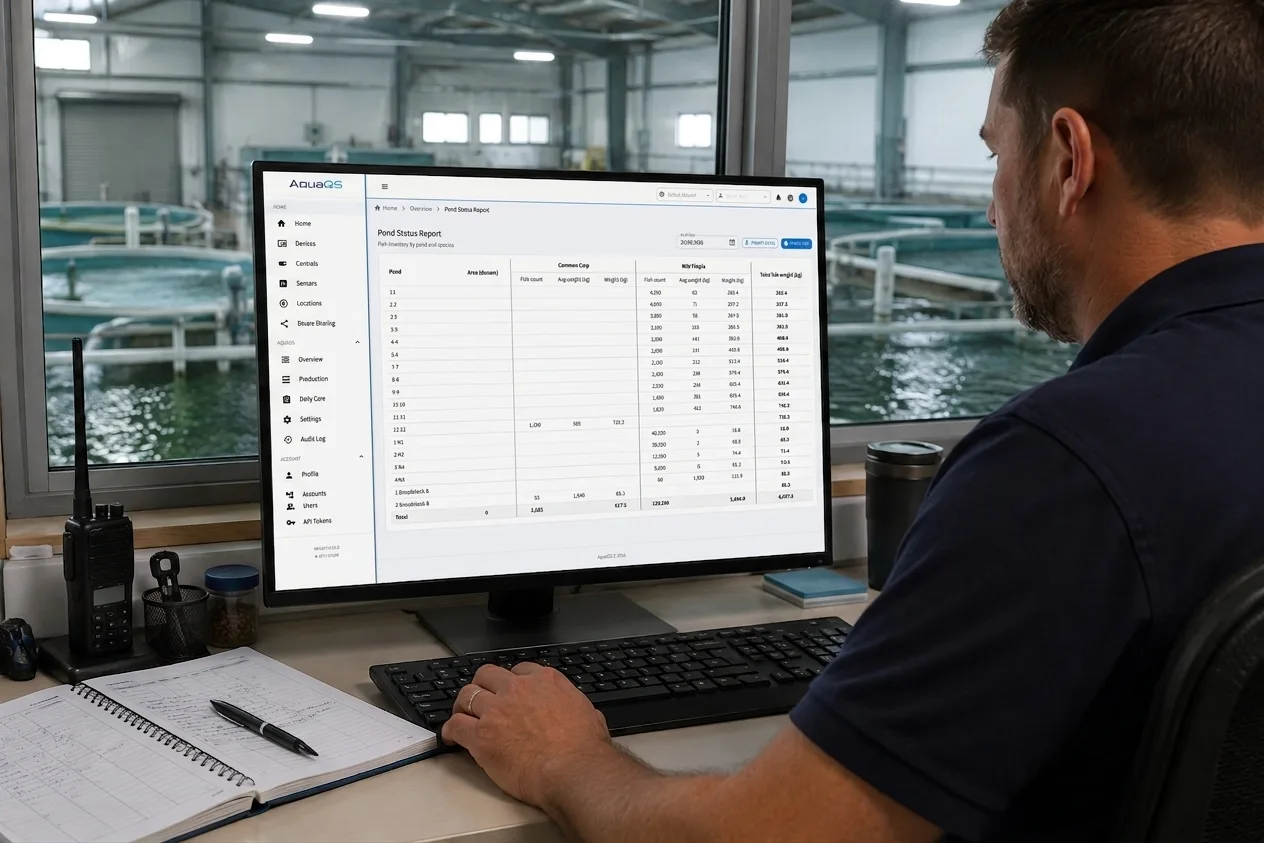
That is how AquaOS computes it. Where a period has two weighings, the feed conversion on the per-pond report is measured on exactly that basis. Where it does not, the biomass comes from the growth model and the report says it is an estimate. The distinction matters because a manager deciding whether to change a feed, a ration or a stocking density should know whether the number came from a scale or a projection.
Two consequences follow for how a farm samples:
- Sampling dates become measurement windows. A pond weighed every two weeks produces a measured conversion every two weeks. A pond weighed only at stocking and harvest produces one, at the end, when it is too late to act.
- Samplings are entered against the batch. The weighing has to land on the batch in the unit, not on the pond in general, so that a unit holding two batches after a co-mingle still yields a conversion per batch.
Biological conversion, economic conversion and cost per kilogram gained
Three figures travel under similar names and answer different questions.
- Biological FCR measures feed against the growth of the fish that survived. It answers whether the feeding worked.
- Economic FCR (eFCR), as the term is used across the industry, divides all feed used by the biomass actually harvested. Mortality, uneaten feed and escapes all land in it, so it is almost always higher. The FCR calculator explains the difference in more detail.
- Feed cost per kilogram gained prices the fed kilograms at what they cost. In AquaOS each dispense is priced against the feed lot it was drawn from, falling back to the feed item cost per kg where no lot covers it, and the figure states whether its basis is lot or item. Lots held in different currencies are never summed. This is covered on the feed cost and conversion page.
Tracking the mass ratio and the money ratio side by side is what separates a feeding problem from a purchasing problem. A cycle whose cost per kilogram gained rose while its biological conversion held steady did not feed worse; it bought feed at a different price.
Per unit, per period, while the cycle runs
A farm-level FCR is an average over ponds that converted well and ponds that did not. It arrives at harvest, when the only use for it is the next plan. FCR tracking earns its place when it runs per growing unit and per period, so a pond drifting above its neighbours on the same feed and the same water shows up with weeks of cycle left.
That requires the same record to hold the feed confirmations, the mortality, the moves and the samplings for every unit. When those live in four spreadsheets, a running FCR per pond is a monthly reconciliation job that nobody has time for. When they live in one production record, it is a report.
What to test in a demo
- A skipped day. Mark one pond not fed for two days and confirm the feed total and the growth attributed to that period both change.
- A plan against a confirmation. Confirm a half ration on one unit and check the feed figure uses what was confirmed, not what was planned.
- A grading in the middle of a period. Move a graded class into a pond between two samplings and check both ponds’ conversions account for the biomass that moved.
- Measured or estimated. Ask the report for a pond’s conversion over a period with two weighings and over one without, and check it labels which is which.
- The same feed at two prices. Record two purchases of one product at different costs and check the cost per kilogram gained carries both, with its basis stated.
A system that passes those five is tracking feed conversion. One that does not is dividing two numbers that happen to be in the same spreadsheet.