Plan vs actual in aquaculture production
A production plan is only useful if it can be compared to what the fish actually did. What the plan, the projection and the record each have to hold.
6 min read
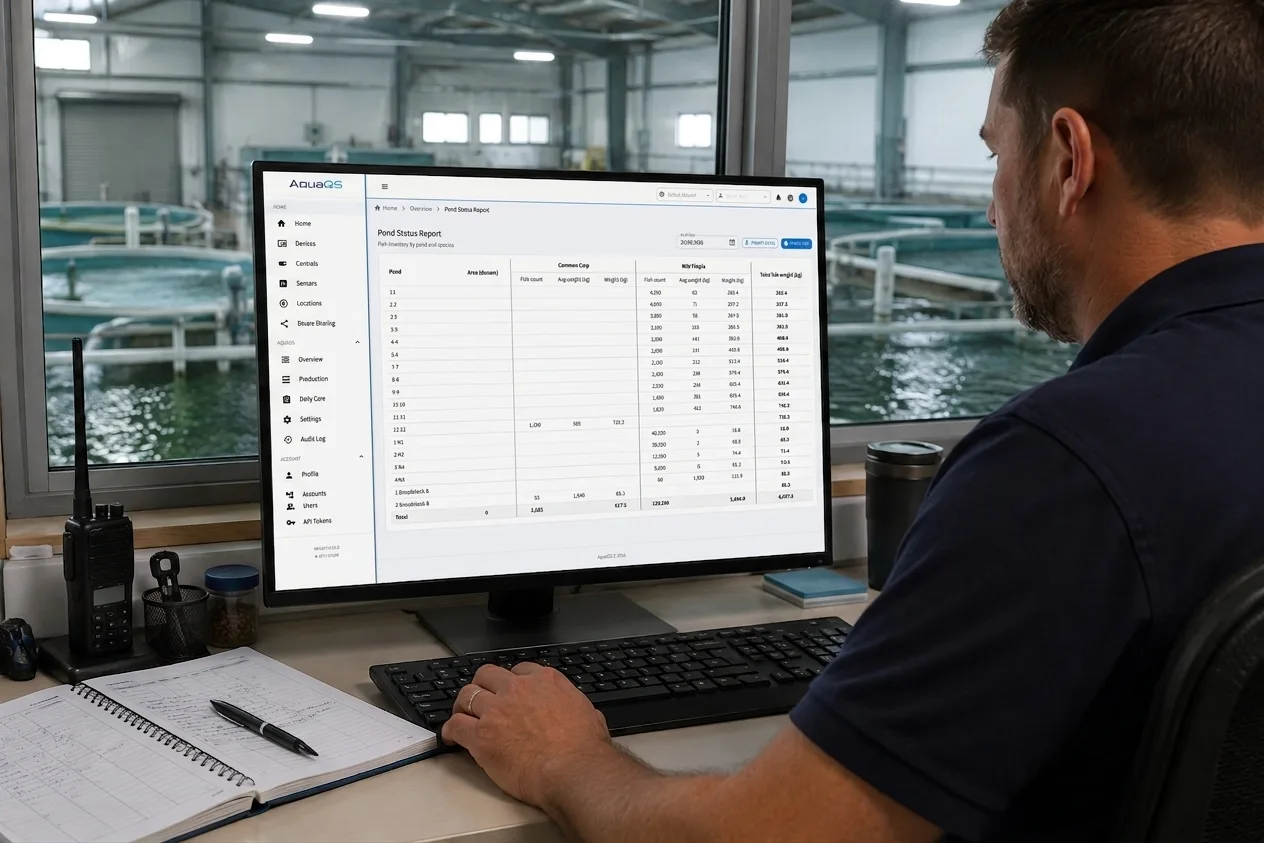
Most farms plan. The plan lives in a workbook, it gets built once a year, and by March nobody opens it. Not because the numbers were wrong. Because comparing it to what happened costs a day of reconciliation every time it is asked, and a plan that costs a day to consult is a plan nobody consults.
That is the whole problem aquaculture production planning software has to solve. Not the grid, which a spreadsheet does perfectly well. The comparison: the plan sitting beside what the fish actually did, refreshed out of records the farm was keeping anyway. A production record that can answer the question on demand turns the plan from an annual ritual into a monthly instrument.
A plan the farm cannot compare against is a document, not a plan
The value of a plan is entirely in the gap it exposes. A target for August is worth nothing on its own. It is worth something next to the stock actually standing in August, which means the two have to live in the same system.
That is also the practical test of any planning feature. Ask where the actual comes from. If the answer is that somebody exports the production data and pastes it beside the targets, the comparison will happen twice and then quietly stop. The version that survives contact with a working farm has exactly one manual input, the targets themselves, and derives everything else from events the operation already records: stockings, sorts, mortality, shipments. Nothing is re-entered, so the sheet is current on a Tuesday afternoon without anyone having prepared it.
Plan each side in the unit it is actually planned in
Farms do not plan one number per size per month. They plan two, and the two are different quantities: how much biomass they want still growing, and how many fish they want ready to sell. Adding them is arithmetic. Storing only the sum destroys information.
So the plan holds both legs, per size band per month, with the grow-out side in kilograms and the ready-to-ship side as a fish count, each in the unit its side is genuinely planned in. The total is derived rather than stored, because the total is what the manager already writes at the bottom of their own workbook. Storing a total and one leg instead makes the other a remainder, and a remainder can never be left empty, which matters more than it sounds.
The bands themselves should be the farm’s own size ladder, the same rungs its grader physically produces, rather than a separate planning vocabulary invented for the module. A plan keyed on sizes the farm does not sort to is a plan that cannot be checked.
A blank cell means not planned, and that has to survive
There is a real difference between planning none of a size in November and not having planned that size at all, and most systems collapse it. A zero is a decision. A blank is the absence of one, and the farm needs to see which cells nobody has filled in yet.
So a blank stays blank. Clearing a cell removes the target rather than setting it to zero, which is what lets the sheet show the sizes nobody has decided on yet. Filling a month from an earlier one is worth having, but it belongs behind an action the planner takes and confirms, never a silent default. The distinction reads as pedantry until the first time a convenience default turns “we have not decided” into “we decided none”, and a size the farm meant to grow drops out of the plan without anyone ever rejecting it.
The projection has to come from the same engine as the daily plan
A forecast the farm does not believe is worse than no forecast, and the fastest way to lose that belief is a projection that disagrees with this morning’s feeding sheet. If the planning module carries its own growth model, the two will drift, and the crew will trust the one they use every day.
Forward projection is computed from the current cohorts and the feed matrix by the same engine that produces the daily ration, so a simulated day equals what the plan will show when that day arrives. The same series then answers the procurement question: projected demand per feed product per day, set against stock on hand, which gives a date per item instead of a hunch about when to order feed.
Growing to plan is measured against modelled, never modelled against modelled
The honest version of “are the fish growing to plan” compares a real weighing against what the model predicted for that same date, projecting forward from the weighing before it. Both halves are anchored in something somebody actually measured.
The dishonest version compares the model to itself. It always agrees, and it is why a lot of growth dashboards look reassuring right up to the harvest that disappoints. The account-wide view worth having lists every active cohort with at least two weighings, shows the last measured weight against the modelled one, and applies a tolerance the farm sets. Cohorts inside tolerance need no attention. What you want on screen is the exceptions.
History has to stay put when somebody backdates a correction
Corrections arrive late. A mortality entered a week after the fact, a grading session reconciled the following morning. If last year’s report is recomputed from live records every time it is opened, those corrections silently rewrite it, and two people comparing the same month end up with different numbers.
The answer is a sealed snapshot: an immutable artifact that stamps its own definitions alongside its numbers, the size ladder in force at the time, the category and variety names then in use, and which package table produced its counts. By 2030, a report re-run from live data would be applying 2030’s definitions to 2026’s fish. A sealed one still means what it meant. That is also what makes a year-over-year comparison legitimate rather than approximate, and what lets two sites be compared at all.
How to test a planning claim in a demo
Ask for three things. Type a target into one cell and have them show you the actual beside it without anyone exporting anything. Clear that cell and confirm the system reports it as unplanned rather than as zero. Then pick a cohort with two weighings and ask what the model predicted for the second one. If the answer to the third is a chart of the model against itself, you are looking at a projection rather than a measurement. The buyer guide covers the structural differences behind those questions, and a demo run on your own size ladder tells you the rest.