Shrimp farm production control: where Excel breaks
Why the shared Excel workbook fails at shrimp farm production control: pond history, feed records, rollups, and what replacing it looks like.
5 min read
Walk into the office of most shrimp farms and production control is one Excel workbook. A tab per pond, a feeding sheet, a column of water parameters, and a laptop it all lives on. The workbook usually started as one biologist’s tool and grew into the farm’s system of record without anyone deciding it should be.
It works until it matters. The failures below are not typing mistakes, they are structural, and they show up at the worst moments of a cycle: population drops, harvest weeks, and the day a buyer asks for history. They are also the reason pond-level production platforms exist as a category.
The workbook is a copy of the farm, updated by hand
Everything in the workbook is a transcription. Feeding happens at the pond, gets noted on paper or in a phone, and becomes a row that evening if nothing interrupts. Every day of the cycle depends on that round trip completing, and on a farm running dozens of ponds it does not always complete. The record silently assumes the plan was executed, so the days a pond was skipped, cut back, or double fed exist only in someone’s memory. A feed conversion ratio built on that is a measurement of the plan, not of the shrimp.
A tab per pond hides the farm
The tab-per-pond layout answers questions about one pond and refuses questions about the farm. What is total biomass in the water today? Which ponds are running behind on growth this cycle? Which ones are burning feed with nothing to show? Every answer means building yet another summary sheet that goes stale the day after it is built.
The per-pond feed conversion problem is the expensive version. A farm-level figure hides the two ponds performing badly behind the ten performing well, and by the time the workbook reveals them, the cycle is over. A live record that rolls ponds up into a farm view makes the variance visible while there is still cycle left to act on it.
Formulas drift and nobody audits them
A workbook this size is software, maintained by copy and paste. Someone inserts a row and a sum range quietly stops one row short. Someone drags a formula across a pond tab and the biomass calculation picks up the wrong column. Nothing errors. The numbers keep looking like numbers, and decisions keep being made on them.
The deeper version of this problem is that a spreadsheet cannot enforce its own bookkeeping when stock moves. Partial harvests and transfers change several tabs at once, and nothing checks that they agree, which is the same structural failure covered in moving aquaculture production off spreadsheets.
The one laptop is the single point of failure
A shared workbook is shared in name only. The working copy lives on one machine, the version on the drive is behind it, and a file named final_v3 is circulating by email. The technician standing at the pond cannot see this morning’s plan, and the owner traveling cannot see yesterday’s mortality. When the laptop fails, the farm’s production history is whatever the last backup happened to catch.
Sampling weeks are the growth curve, and the workbook loses them
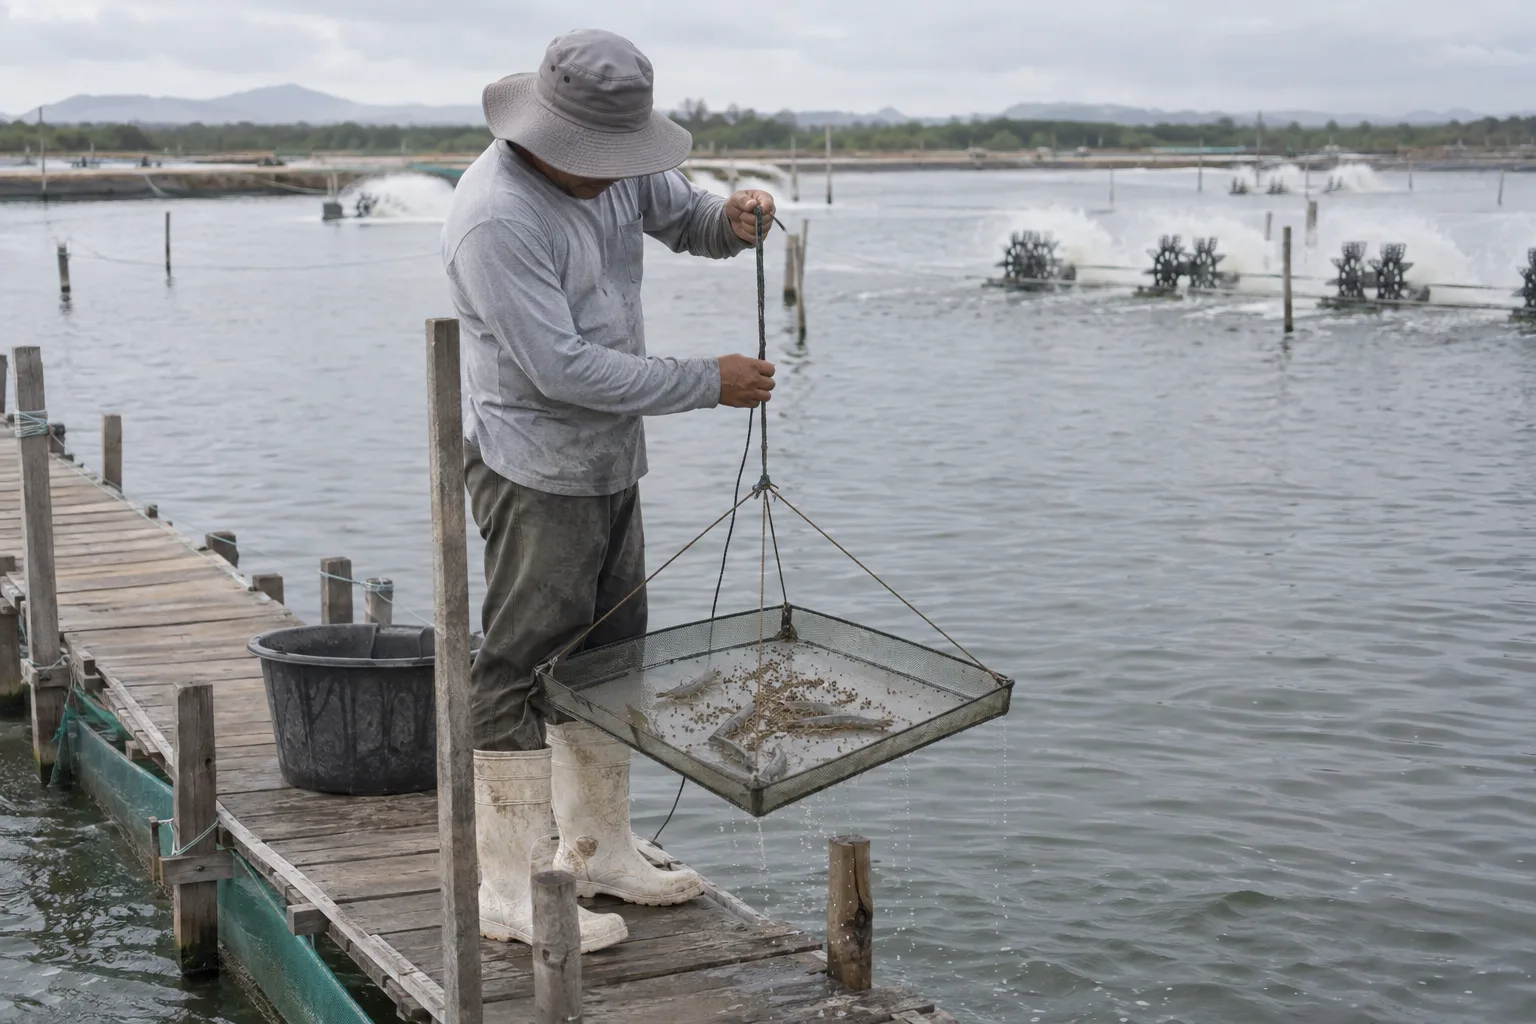
Weekly weight sampling is how a shrimp farm knows anything: it sets the average weight, which sets the biomass, which sets the ration and the moment to change feed. In the workbook, sampling lives in its own tab, and someone has to carry each result into the pond tab and the feeding sheet by hand. When that step is late, the farm feeds last week’s shrimp.
In a live record, a sampling entry against the pond’s batch updates the average weight once, and everything derived from it follows: the biomass, the day’s ration, the growth curve the cycle is judged against. One entry, entered where the work happened, instead of three copies racing each other across tabs.
Harvest reconciliation happens from memory
A vannamei cycle rarely ends in one clean day. Partial harvests come out over weeks, transfers move animals between ponds, and each event changes the count, the biomass, and the feed plan of more than one pond. Reconstructing that at the end from tabs and notebooks is where survival rates get invented, and an invented survival rate poisons the planning of the next cycle.
What replacing the workbook actually looks like
Not a bigger spreadsheet. The pond becomes a unit holding a live stocking record, daily feeding comes off the farm’s own feed table and gets confirmed per pond, mortality and sampling land in the same record, and water parameters bind to the pond whether entered by hand or read continuously. Rollups, per-pond reports, and cycle comparisons come off the live record instead of being rebuilt each time, and they export back to Excel for whoever still wants the workbook.
Setting that up is describing the farm: ponds, species, the feed table, and a count with an average weight for what is in the water. From there the record is live. If the workbook is staying for now, at least give it structure: the free shrimp farm record keeping template is the daily pond log from this article as a ready Excel file. A demo run on your own pond list and your own feed table shows the difference faster than any feature comparison.