Moving aquaculture production off spreadsheets
Which operation breaks your spreadsheet first, why the fix is a data model rather than a better template, and what a migration actually involves.
5 min read
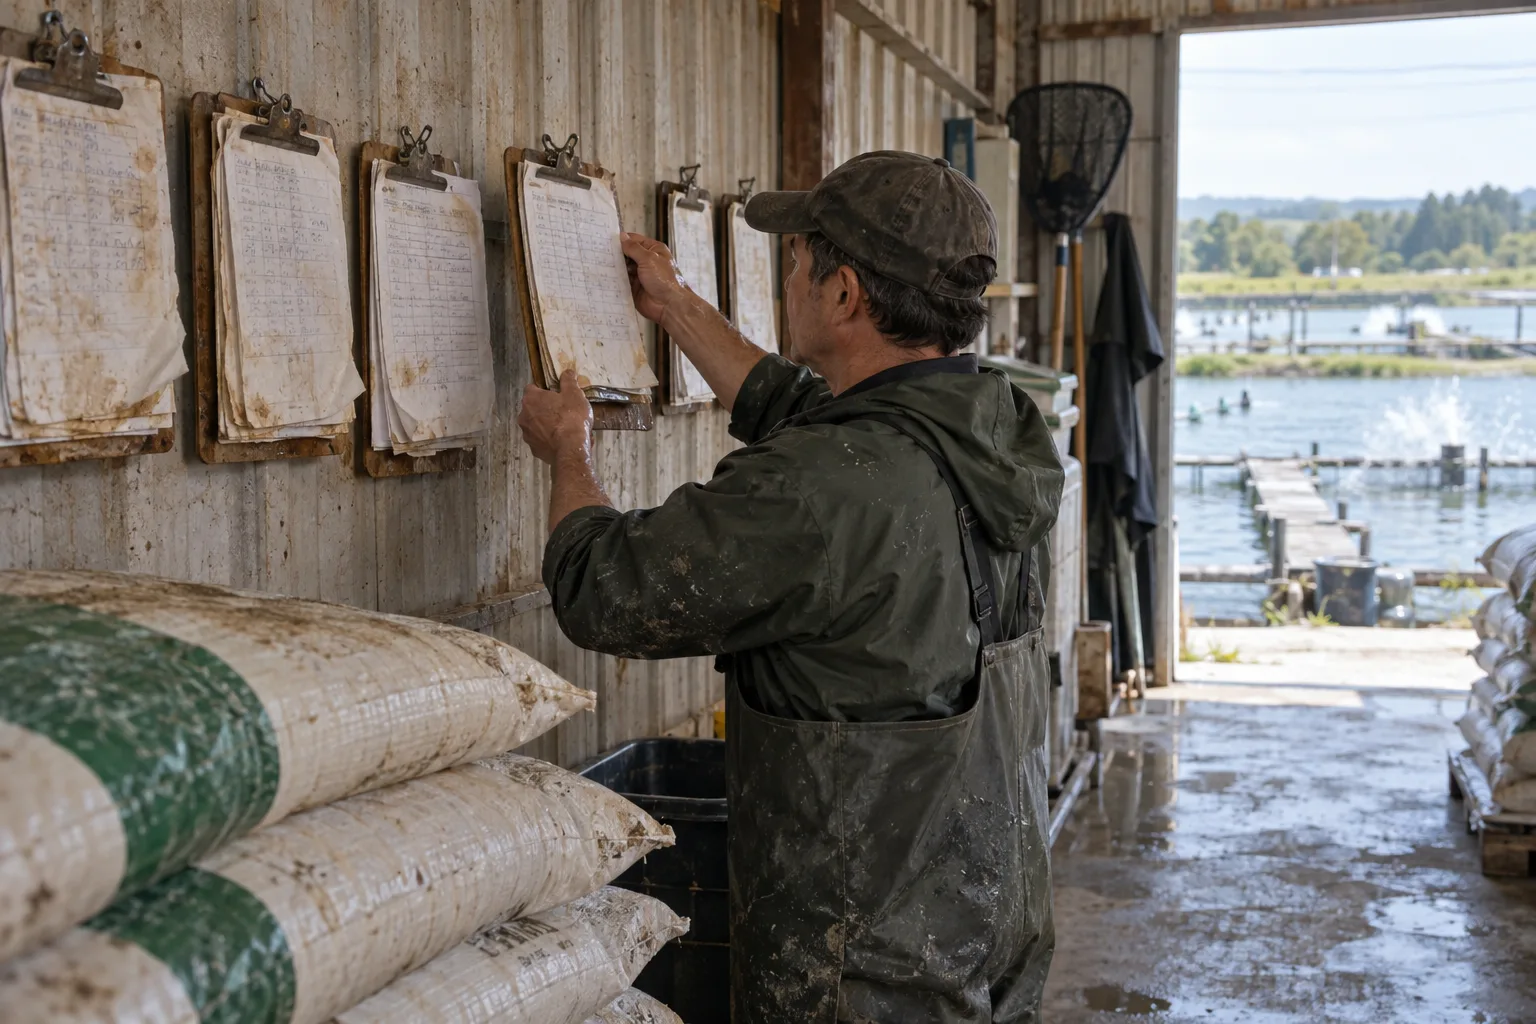
Almost every aquaculture operation starts on spreadsheets, and for a while they work. A feeding sheet, a mortality log, a stocking record. Each one is accurate on its own. The trouble starts when they have to agree with each other.
The operation that breaks it
It is not volume. Farms run enormous spreadsheets for years without trouble. It is a specific operation: splitting a population across units.
A split moves part of a batch out of one pond and into another. In the record that means the source count goes down, a new placement appears in the destination, biomass is apportioned between them, and the feeding sheet has to pick up two entries where it had one. Four changes, all of which have to happen together, none of which a spreadsheet enforces.
In practice one of them gets missed. The feeding sheet updates because it is the one someone looks at daily. The stocking sheet does not. From that day forward the biomass everyone plans against is wrong, and because rations are calculated from biomass, the error does not sit still. It propagates into every feeding for the rest of the cycle and shows up eventually as a growth curve that does not match the feed spend.
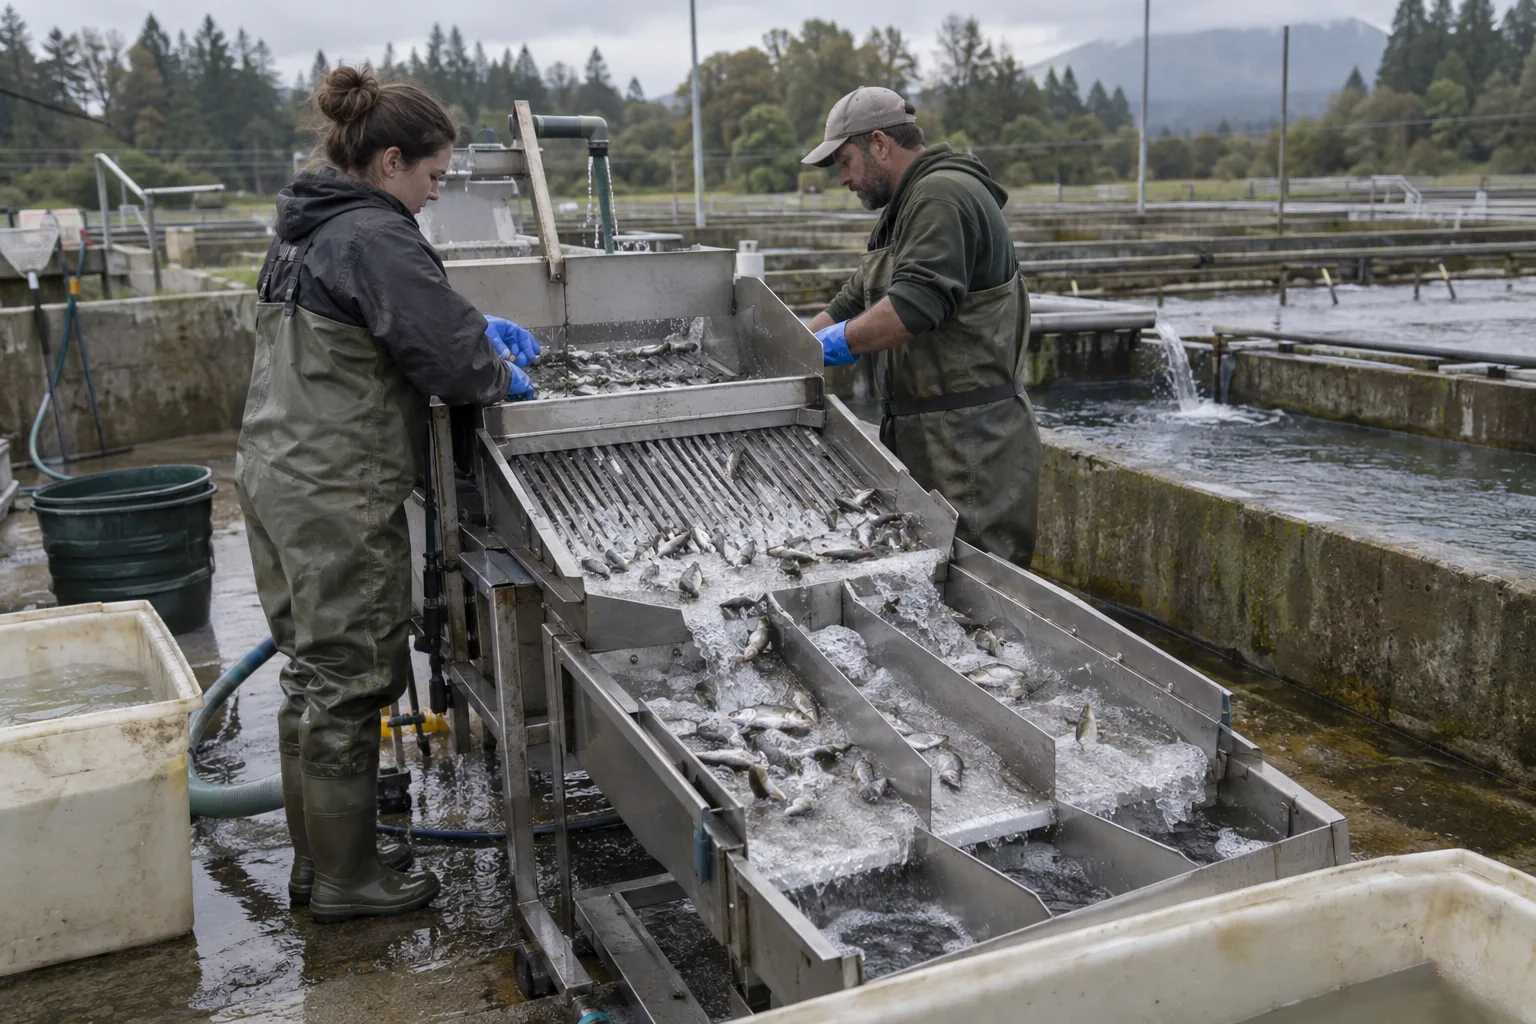
Grading day is the same failure at ten times the scale. Several ponds emptied, size classes distributed across several more, thousands of animals moved in an afternoon. Nobody reconstructs that correctly from memory at 18:00.
Why a better template does not help
The instinct is to fix the sheet: more validation, a summary tab, a macro. It does not work, and the reason is structural.
A spreadsheet represents a batch as a row, and a row is in one place. Aquaculture stock is not in one place. A population can occupy three ponds at once, each with its own count and average weight, and it can share a pond with another population. Representing that in rows means either duplicating the batch across rows, which destroys the identity, or forcing one row per pond, which destroys the continuity.
What is actually needed is two things instead of one: the batch, which is the population with its species, origin, and lineage, and the placement, which is that batch sitting in a specific unit for a specific period. Once those are separate, a split is a normal operation rather than a reconciliation problem. That separation is the whole point of production tracking in a real production platform, and it is the thing a spreadsheet cannot be extended into.
What else stops being manual
The batch model is the reason to move, but it is not the only thing that changes.
Rations stop being recalculated by hand. A feed matrix keyed to species, weight band, and phase produces the daily ration per unit from current biomass. Nobody re-derives the table when the fish grow. See feeding and feed control.
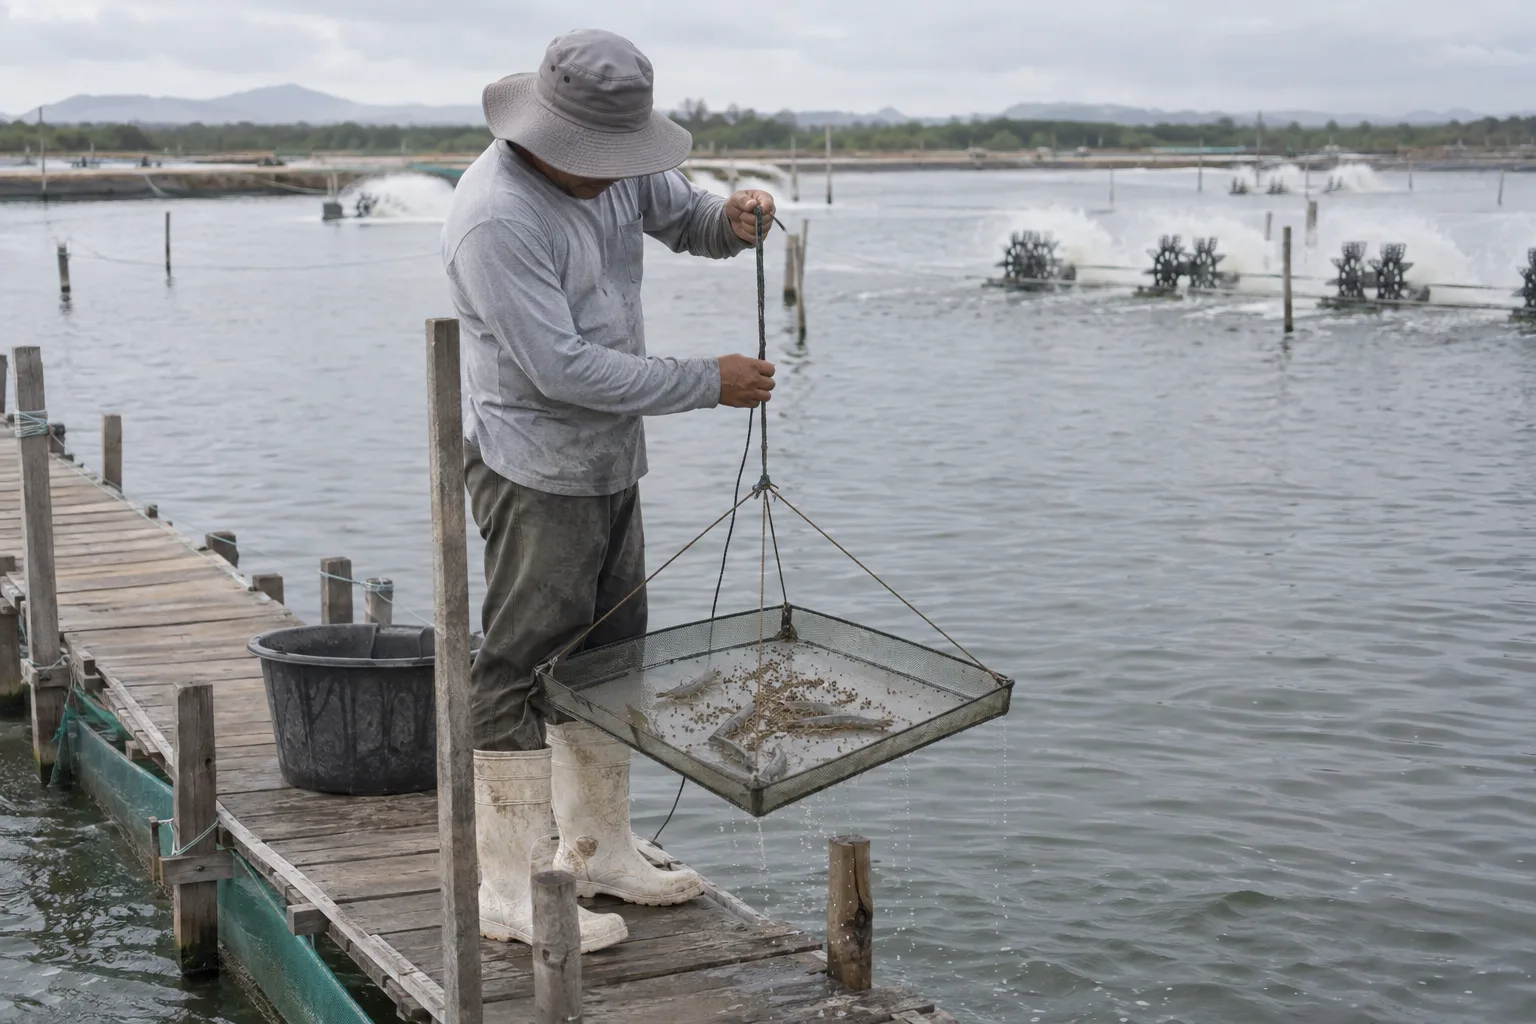
Not-fed days become data. A feeding sheet records feedings. It does not record the days a pond was skipped, so the record silently assumes the plan was executed. Any feed conversion figure calculated from a plan nobody confirmed is measuring the plan, not the fish.
Water quality joins the same record. Sensor readings bound to the growing unit sit next to the batch that was in it, so an oxygen event and the mortality that followed appear on one page. See water quality monitoring.
Reports stop costing a day. Pond status and per-pond production reports come off the live record and export to Excel or print as PDF. See reporting and traceability.
What migration actually involves
Less than most people expect, because there is no point importing years of spreadsheet history that was already drifting. The useful migration is forward-looking.
- Describe the farm. Sites, growing units, and unit types. A pond, a raceway, a tank, and an incubator each carry their own defaults for area, volume, and feeding.
- Describe the biology. Species, varieties, cultivation phases, and the feed matrix. This is where the operation’s existing practice becomes the system’s rules, and it is the step worth spending real time on.
- Stock what is in the water. Each occupied unit gets a count, an average weight, and a phase. That is the opening balance.
- Run both for a cycle if you want to. Some operations keep the sheet alongside for a few weeks. Most stop when the first split goes through cleanly.
Historical data is worth importing only where it will be read: a previous cycle on a pond you want to compare against, for instance. Importing five years of a sheet whose totals never reconciled just moves the problem into a new system.
When it is worth doing
The honest answer is when the reconciliation cost exceeds the switching cost, and that threshold arrives earlier than most farms think. A single mis-tracked split that runs a whole cycle at the wrong ration costs more in feed than the software, and it is invisible until the harvest weight comes in low.
If you are weighing this up, the practical starting point is not a feature comparison. It is to take the operation that breaks your sheet most often, usually a split or a grading day, and make every vendor on your list do it live. The buyer guide covers the rest of that evaluation, and a demo is worked through on your own scenario rather than a sample dataset.